The Svalbox Interactive Map#
Introduction#
The Svalbox Map is designed to provide an interactive interface to discover Svalbard’s geology.
To access the Svalbox Map, open your web browser and enter the following URL or click here:
http://www.svalbox.no/map
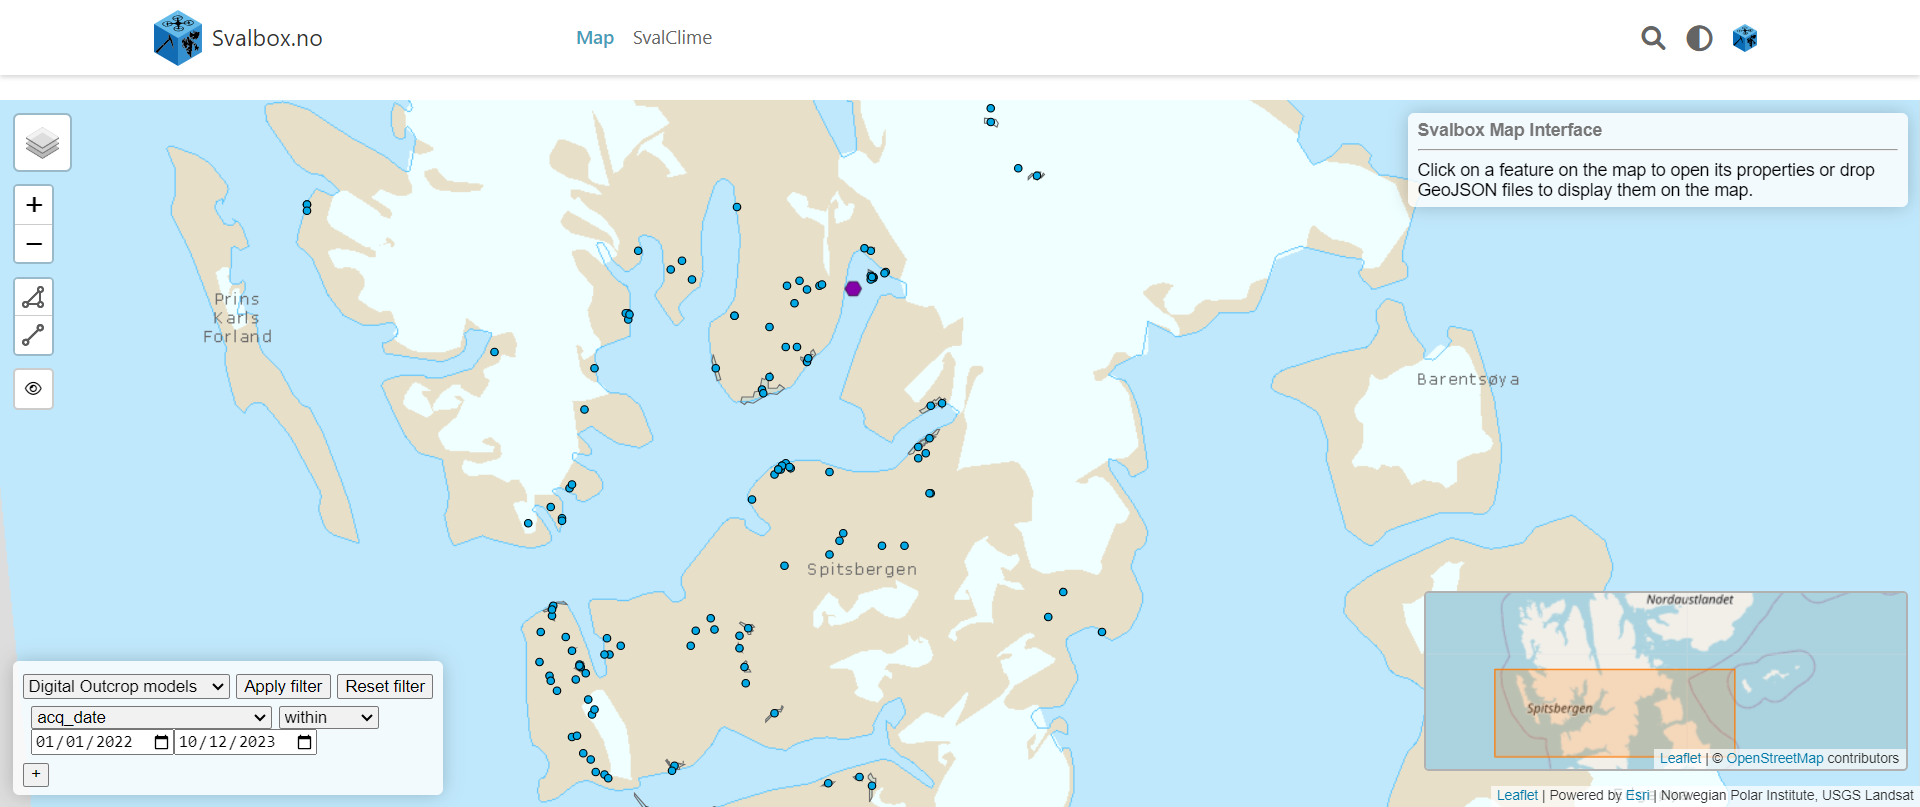
Fig. 2 Landing portal of the Svalbox interactive map. 2023 version.#
Key Features#
The Svalbox’s interactive map is designed to provide users with a comprehensive and intuitive experience. The key features are:
A range of data layers that can be interacted with to reveal different aspects of the area.
A search functionality to quickly find specific Digital Outcrop Models (DOMs) and other features of interest.
The map includes tools that enable users to measure distances and areas on the map with ease.
Getting Started#
Navigating the Map#
To zoom in or out on the map, use the scroll wheel on your mouse. Alternatively, you can click on the plus and minus icons located on the left side of the screen. To move around the map, simply left-click your mouse.
Fig. 3 Example of zooming in and out and panning across the interactive map.#
Changing Map Layers#
Located at the top-left corner of the interactive portal is the layer pane. This feature allows you to easily switch and visualize various map layers. The layers available include a variety of datasets stored in the Svalbox file database, as well as other open databases such as the one provided by the Norwegian Polar Institute. The layers available to date are:
Norwegian Polar Institute - satellite
Norwegian Polar Institute - geology
Norwegian Polar Institute - basemap
Seimic
Sedimentary logs
Drone footage
Photo spheres
Boreholes
Virtual outcrop Models
Virtual Field Guides
Fig. 4 When starting, the default layers are the base map from Svalbard provided by the Norwegian Polar Institute database, the Virtual outcrop Models, and the Virtual Field Guides.#
Measuring Tools#
The measuring tools provided with the Svalbox interactive map are designed to give users the power to measure distances, areas, and other spatial dimensions accurately.
These tools include:
Distance measurement (for determining the length between two points)
Area measurement (for calculating the size of a defined region)
These tools aim to help you analyze geographical features and better understand their spatial relationships and dimensions.
Fig. 5 Measuring the transect of Virtual Outcrop Models on the northern coast of Van Keulenfjorden. Steps: 1. Disable base map; 2. Click on measuring tools and edit your vertices; 3. Click finish to get the total distance (in km) in the top-right part of the online interface.#
Disable basemap layer
When using the measurement tools, remember to disable the base map layer from the online interface since the measurements are displayed under this layer.
Search Functionality#
The search function allows users to efficiently locate specific Virtual Outcrop Models (VOMs) by applying various filters related to the parameters of each model. These filters include acquisition parameters, camera models used, model location, ground resolution, data authorship, geological aspects, and the total area of each model.
The search functionality enhances the user experience by providing streamlined access to the relevant VOMs within the interactive map interface.
Apply filter
When searching with a filter option, remember to click “Apply filter”.
Fig. 6 Example of Virtual Outcrop Models search based on the Land the models are located in Svalbard.#
Map Layers#
By clicking the different objects in the map layers, a pop-up with all the information will open in the uper-right corner of the interactive portal. Some of them are linked to other repositories where the data is stored.
Geology#
The Svalbox interactive map includes a digital geological map of Svalbard, which is provided by the Norwegian Polar Institute. The map uses a stratigraphic classification system to divide the geology into groups, subgroups, and formations, depending on the appropriate scale. In areas where formations are not defined, lithological units are used instead. The map is accurate to a scale of 1:250000.
Fig. 7 Click on the DOI link related to the selected geological layer. A new tab will open linking to the Norwegian Polar Data Centre, from where you can download the Geological map of Svalbard (1:250000) amongst other data.#
Photo spheres#
One of the main assets of the Svalbox interactive map is an incredible collection of photo spheres. These are aerial drone 360-degree panoramic images that cover various locations across the archipelago. They are a very useful resource to get an overview of a wan area.
Qualitative data
While photo spheres are very useful, they only provide qualitative data. Do not base any measurements on them since they result from stitching a series of images together, interpolating, and distorting them to give the 360° visual effect.
Fig. 8 When you click on a photo sphere, a pop-up will appear on the top-right corner of the interactive portal. Press Click to Load Panorama to visualize the image in 360°.#
The DOI link above the photo sphere connects to a Zenodo repository where you can find all the photo spheres collected by the Svalbox Team over a natural year in various acquisition campaigns. It’s important to keep in mind that there are multiple versions available for each dataset. We recommend using the latest version to ensure access to the most updated data.
Fig. 9 Accessing the Zenodo repository where the dataset for the 2022-photo spheres have been uploaded.#
Virtual Outcrop Models#
Virtual Outcrop Models (VOMs) or Digital Outcrop Models (DOMs) are three-dimensional representations of geological outcrops. They are created by integrating images using a structure-from-motion workflow. These models are a powerful tool for gaining insights into geological structures, sedimentary patterns, and stratigraphic relationships. They enhance the accessibility and visualization of geological information, facilitating more accurate and detailed geological interpretations.
They are the main asset of the Svalbox database, which gathers hundreds of models from all over the Svalbard archipelago.
To visualize the VOMs in 3D, they are uploaded in Sketchfab.
Sketchfab
For more information on uploading Virtual Outcrop Models to Sketchfab, click here.
Fig. 10 Click on the Svalbox or Sketchfab icons on the left-hand side of the model visualizer. A new tab will open, linking to the Svalbox models uploaded onto Sketchfab, a platform that enables you to explore and visualize the 3D models with ease.#
You can download all the information related to the VOMs uploaded in Svalbox from the Zenodo database.
Each VOM is uploaded as a single dataset containing all files related to the model:
Configuration file: Contains all the metadata related to the model.
Metashape folder: Includes the Agisoft metashape project and the processing reports.
Data folder: Contains all the raw data used in the model.
Export folder: With all the object and texture files.
Image overview.
Each VOM has a unique DOI, making it easy to find and cite.
Fig. 11 Click on the DOI link of the model. A new tab will open linking to the Zenodo database, from where you can download all the data.#
Virtual Field Guides#
A Virtual Field Guide (VFG) is an interactive digital resource that enables you to explore geological sites and formations without being physically present.
The Svalbox interactive map includes multiple VFGs focused on geology (displayed as purple hexagons) and biology (displayed as green hexagons).
Fig. 12 Click on the Virtual Field Guide and explore the different localities of the field trip by clicking to the icons that appear on the screen.#
While Svalbox offers a few VFGs, VR Svalbard has extensively developed this resource for geological VFG, enhancing its functionality and features. Learning Arctic Biology, has also developed multiple biological VFGs mainly targeting Arctic flora.